
The Random Shuffle of Genes:
Putting the E in EPD
Jared Decker
University of Missouri Extension
DeckerJE@missouri.edu
*Click here for printable pdf version.
Summary: Why are EPDs imprecise for young animals? How can genomics be used to track the random shuffle of genes?
Even though expected progeny differences (EPDs) have been used by the beef industry for over 40 years, many misconceptions still exist. Occasionally we will hear a producer say something like, “I bred my cows to a low birth weight bull, but I had a couple of large calves.” What the producer does not realize is that this is to be expected based on the inheritance of complex or continuous traits. Let’s look at this more closely.
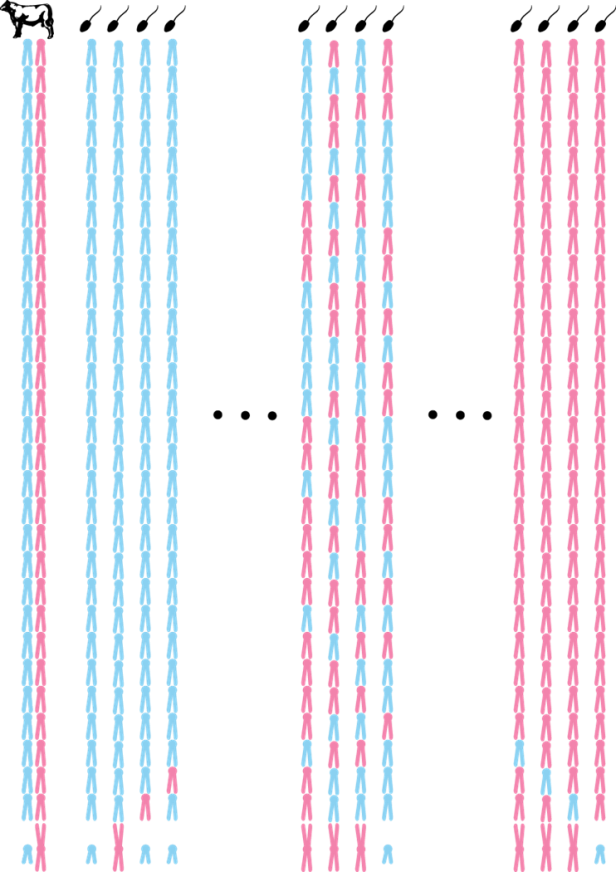
A calf inherits about 50% of its DNA from its sire, with the other 50% coming from its dam. Each sperm that is produced by a sire is a random sample of that sire’s chromosomes and genes. Cattle have 30 pairs of chromosomes. So, when a sperm is produced, it is similar to flipping 30 coins. If we label the chromosomes the sire inherited from his father as blue/paternal and the chromosomes inherited from his mother as pink/maternal, there are 1,073,741,824 possible combinations of the sire’s paternal and maternal chromosomes (See Figure 1). And, this number ignores the swapping of parts between paternal and maternal chromosomes in a biological process called recombination. So, the number of possible chromosome combinations is in the billions! We often state this as progeny receive a random sample of the sire’s genes, and with billions of possible combinations no two sperm are exactly alike (the same is true for eggs produced by the dam).
 |
|
Figure 1. Illustration of the shuffling of chromosomes that occurs during sperm formation. The first column represents the bull’s two sets of chromosomes. Chromosomes inherited from the bull’s sire are in blue. Chromosomes from the bull’s dam are in pink. The other columns depict possible combinations of paternal and maternal chromosomes in individual sperm cells. There are over 1 billion possible combinations. |
Think for a moment about your favorite set of full siblings (brothers or sisters with the same parents). Perhaps this is the celebrity family with a reality television show, your brothers and sisters, your children, or your favorite set of embryo flush mate calves. The dissimilarity between these siblings may be striking, for example, one may be short and the other tall, one may have light hair and the other dark hair, or one may be laid-back and the other excitable. The similarities between siblings are due to shared environment and shared genes. The dissimilarities between siblings are due to differences in environment and genes which are not shared. Siblings share 50% of their DNA on average, but in humans this can vary from about 40% to 60% (See Figure 1 in http://tinyurl.com/eBEEF-Visscher2006). Because their genomes are similar in size, we can expect a similar distribution of shared genes in cattle. The sharing of genes between siblings (except identical twins) is due to the random segregation and shuffling of genes during the formation of sperm and eggs.
If we assume random mating and that the parents are unrelated, we can show mathematically that the breeding value variation (i.e. EPD variation) observed between a set of full siblings (calves with the same parents) will be half of the breeding value variation observed in the population. Even if our assumptions about random mating and unrelated parents do not hold up in real populations of cattle, the variation between full siblings will still be quite substantial. Research in Brown Swiss, Holstein, and Jersey dairy cattle provides evidence that the variation between full siblings is very close to, if not greater than, one half of the population’s genetic variance (the variation in EPDs or breeding values, see http://tinyurl.com/eBEEF-ColeVanRaden2011). The EPDs reported by breed associations can be thought of as one half of the sire’s breeding value plus one half of the dam’s breeding value plus the Mendelian sampling term (EPD_calf=1/2 EPD_sire+1/2 EPD_dam+Mendelian Sampling). The Mendelian sampling term represents a calf’s difference from the average of the parent’s breeding values. This difference is due to the random sample of genes and chromosomes that the calf inherited. When a calf is born, we have no data, so we assume this Mendelian sampling term is zero and the EPD is reported as the parent average. As we gain more data about the calf and the calf’s eventual progeny, we are better able to estimate this Mendelian sampling term and the EPD accuracy increases and the EPD estimate either increases or decreases.
Unfortunately, in the past embryo transfer flush mates have been marketed by some seedstock producers as containing identical genetics. The only cattle that share identical genetics are identical twins and clones (but even clones do not share short segments of DNA, i.e. mitochondrial DNA). Because birth weight and weaning weight data from embryo transfer calves are not typically used in national cattle evaluation (as the calves are reared by recipient dams not the biological dam), the flush mates have identical EPD profiles early in life. These EPD predictions remain identical until data on the flush mates’ progeny is recorded. These identical EPD profiles are simply the parent average EPDs. Like all parent average EPDs, these EPDs are not precise (reported as EPD accuracy) because the EPD estimation equations do not have data to predict the gene variants inherited from the sire and dam. In other words, without data the EPD equations are not able to predict the Mendelian sampling term, the random set of genes inherited as a result of gene segregation and shuffle. Traditionally, EPDs for flush mates have not changed until data about the progeny of the flush mates were recorded.
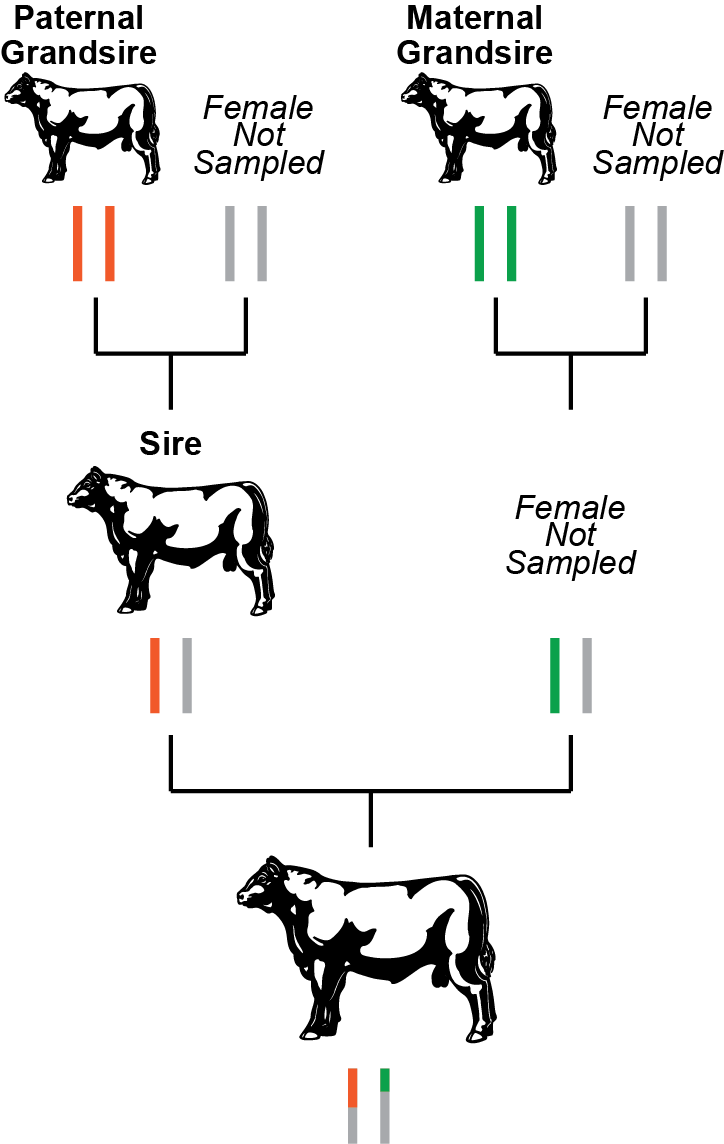
With new genomic technology the Mendelian sampling term can now be estimated for flush mates and other progeny. Genetic tests that provide genotypes on thousands of DNA variants enable an estimation of which set of genes an animal actually inherited. Genomic testing provides an estimate of the Mendelian sampling term and the genetic merit associated with the inherited variants. This information is then combined with the traditional pedigree EPDs to produce more reliable genomic-enhanced EPDs. In a roundabout way, this technology is tracking which bits of the sire’s and dam’s chromosomes were inherited. In a slightly different approach used by the dairy breeds and by the Santa Gertrudis beef breed, the pedigree relationship information used to calculate EPDs is supplemented with genomic relationship information. Shared DNA variants are used to estimate how closely related two animals are, in other words their genomic relationship. This procedure can tell whether a calf is more closely related to its paternal grandsire or its paternal granddam, thus tracking the inheritance of the sire’s chromosomes and identifying the Mendelian sampling term. See Figure 2 for an example based on real world data. Based on averages, we would expect a calf to share 25% of its genes with any of its grandparents. But, due to the random shuffle of genes and chromosomes, this percent can vary greatly. Whether genomic data is used to produce a genomic prediction or supplement the relationship estimates, both of these approaches increase the accuracy of the EPD as they provide data that allows the Mendelian sampling term to be estimated.
 |
|
Figure 2. Pedigree-based versus genomic-based relationships. Based on the pedigree, we would expect the bull at the bottom of the figure to share 25% of his genes with his paternal grandsire (orange chromosome pair) and his maternal grandsire (green chromosome pair). But, when we calculate the actual percentage of shared genes, he shares 25.8% of his genes with his paternal grandsire and 15.4% with his maternal grandsire. Based on actual data from a popular AI sire. |
It is important to remember that EPD stands for expected progeny difference. Expected refers to a statistical expectation, which means a prediction or average. Thus an EPD is the predicted average difference between a sire’s calves and the EPD base. EPDs predict averages, because for a large group of calves the Mendelian sample term approaches zero. An individual calf can have a very different genetic merit from the sire (a large Mendelian sample term) due to the random sample of genes it inherited.
In conclusion, a calf shares 50% of its DNA with its sire and 50% of its DNA with its dam. On average, two full siblings also share 50% of their DNA. But, which DNA variants are shared between a parent and a calf or two full sibling calves at birth is unknown. Because of this parent average EPDs are used for young calves. It is only when more data are collected that we are able to estimate this random sample of genes (i.e. the Mendelian sampling term). Genomics provides information that enables the Mendelian sampling term to be estimated. Genomic-enhanced EPDs use DNA information to estimate the random sample of genes inherited from the parents and result in more accurate and reliable EPDs for young animals. The random shuffle of genes and chromosomes puts the expected in EPDs.